TABLE OF CONTENTS
Placeholders
Client Info
| Label | Placeholder | Unit Type | Description | Example |
| Client Name | \\client_name\\ | Text | Name of the client | Generic client |
| Client Fiscal ID | \\fiscal_id\\ | Text | Tax identification number | 12345 |
Facility Info
| Label | Placeholder | Unit Type | Description | Example |
| Energy Supply Code | \\delivery_point\\ | Text | Messlokations-ID | DE0000000011111 |
| Facility Address | \\fac_address\\ | Text | Address of the facility | My Facility |
| Average Tariff | \\avg_tariff\\ | Number (€/kWh) | Average electricity tariff | 0,3 |
| Contracted Power | \\contracted_power\\ | Number (kW) | Contracted electricity power | 50 |
| Annual Consumption | \\an_con\\ | Number (MWh) | Annual electricity consumption | 600 |
| Annual Consumption Cost before PV | \\energy_cost\\ | Number (€) | Energy cost with the average tariff - does not account with fixed energy costs | 180 |
Proposal Info
| Label | Placeholder | Unit Type | Description | Example |
| Proposal Number | \\proposal_id\\ | Number | Number of the proposal | 12345 |
| Proposal Date | \\date\\ | Date | Date on which the proposal was made | 1. Januar 2000 |
Technical Info
| Label | Placeholder | Unit Type | Description | Example |
| Peak Power | \\ppower\\ | Number (kWp) | Peak power of the solar panels | 121 |
| Panel Area | \\area\\ | Number (squared meters) | Total area of the solar panels | 880 |
| Number of Panels | \\num_panels\\ | Number | Number of solar panels | 12 |
| Nominal Power | \\npower\\ | Number (kW) | Nominal power of the solar panels | 100 |
| Annual Production | \\prod_kwh\\ | Number (kWh) | Annual production of electricity | 96775,67 |
| Annual Production | \\prod_mwh\\ | Number (MWh) | Annual production of electricity | 96,78 |
| Annual Specific Production | \\sp_prod\\ | Number (kWh/kWp) | Amount of energy generated annually per unit of installed capacity | 797,43 |
| Annual Self Consumption | \\sc_kwh\\ | Number (kWh) | Annual consumption of self-produced electricity | 80870 |
| Annual Self Consumption | \\sc_mwh\\ | Number (MWh) | Annual consumption of self-produced electricity | 80,87 |
| Annual Injection | \\inj_kwh\\ | Number (kWh) | Annual injection of electricity into the grid | 15910 |
| Annual Injection | \\inj_mwh\\ | Number (MWh) | Annual injection of electricity into the grid | 15,91 |
| Grid Consumption before PV | \\g_con_kwh\\ | Number (kWh) | Grid consumption before the adoption of solar panels | 599500 |
| Grid Consumption before PV | \\g_con_mwh\\ | Number (MWh) | Grid consumption before the adoption of solar panels | 599,5 |
| Grid Consumption after PV | \\g_con_pv_kwh\\ | Number (kWh) | Grid consumption after the adoption of solar panels | 518600 |
| Grid Consumption after PV | \\g_con_pv_mwh\\ | Number (MWh) | Grid consumption after the adoption of solar panels | 518,6 |
| Consumption Reduction | \\con_red\\ | Number (%) | Percentage reduction in consumption from the grid | 13,49 |
| CO2 Avoided | \\kgco2\\ | Number (kg) | Factor of 338 grams of CO2 emitted per kwh in Germany | 27334,13 |
| Tons of CO2 Avoided | \\tco2\\ | Number (tons) | Factor of 338 grams of CO2 emitted per kwh in Germany | 27,33 |
Images
For images you can add a shape, and give it a name under Home>Arrange>Selection Pane and edit the name of the image:
Picture Description | Object Name / Placeholder | Example |
| 1st Quarter Average Daily Production and Consumption | prod_q1 | 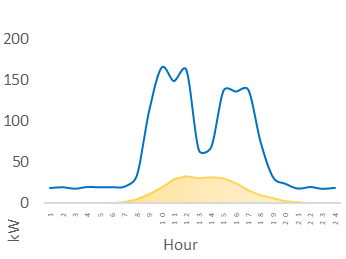 |
| 2nd Quarter Average Daily Production and Consumption | prod_q2 | |
| 3rd Quarter Average Daily Production and Consumption | prod_q3 | |
| 4th Quarter Average Daily Production and Consumption | prod_q4 | |
| Graph with Value of Investment and Savings along the Years | graph_upfront | 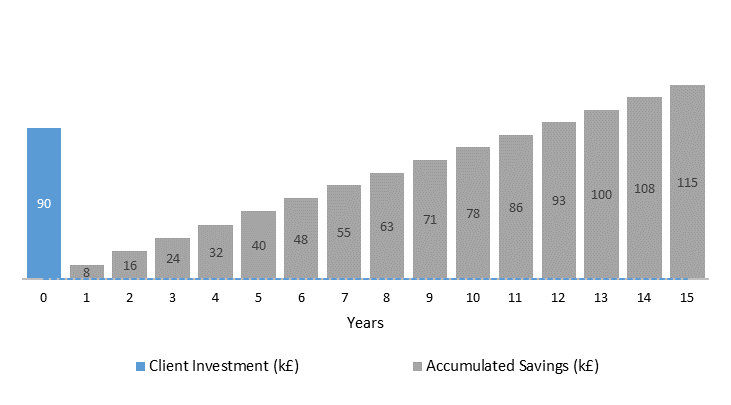 |
| Top View of your Design | ic | 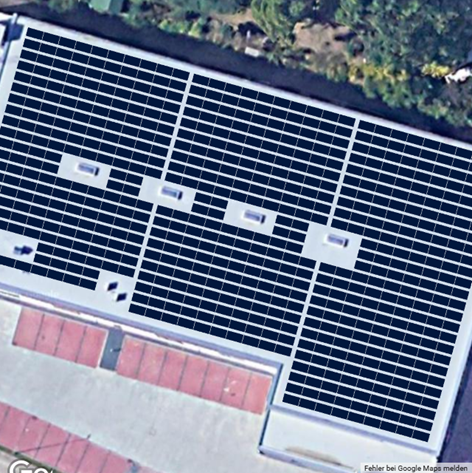 |